2.0 INTRODUCTION
In an autonomous nonlinear system the differential equations contain nonlinear terms. There are many applications of these systems including
When a simple plane autonomous system is linear, there is only one equilibrium point which is at (0,0) and a precise geometrical description of solutions is possible, both near the equilibrium point and globally once the stability of the equilibrium point has been determined and the phase plane diagram drawn.However, a non-linear autonomous system may have many equilibrium points. Its phase plane diagram is more complicated and can be difficult to interpret. Will a knowledge of the stability of the equilibrium points help us investigate the long term behaviour of a non-linear system?Investigation 1
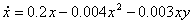
Consider the competition model
The equilibrium points are (0,0),(0,100),(50,0) and (20,40). Click on
each equilibrium point to see a phase diagram of the region close to the
equilibrium point. Can you decide which equilibrium points are stable and
which are unstable?
| Hint | Ans. |
How can we use this knowledge to help us understand the long term behaviour of the model?
Look at the curve labelled A. Starting with small values of x and y, initially, as the curve moves away from the unstable equilibrium (0,0) towards the equilibrium (20,40) the values of x and y increase until y reaches its maximum value. The curve now comes under the influence of the unstable equilibrium point (20,40) and is repelled by it and driven towards the stable equilibrium point (50,0). Thus x continues to increase whilst y decreases so that in the long term x approaches the value 50 and y dies out.
The biological interpretation is that the two populations are competing for a limited resource which initially is sufficient for both populations to increase. Eventually there is not enough resource to sustain both populations so y begins to decrease and becomes extinct leaving all the resources for x which then increases until its carrying capacity of 50 is reached.
Now look at the curves labelled B, C, and D and see if you can describe what is happening on each of these curves and interpret the trends.
In this model the initial conditions are crucial. Can you see why the starting point is so important?
This example suggests that a natural first step towards understanding a nonlinear system would be to investigate the equilibrium points. In this unit you will learn